
Bitcoin Bullish Signal: Netflow Observes Sharp Negative Spike

On-chain data shows Bitcoin netflows have observed a sharp negative spike recently, a sign that could be bullish for the crypto.
Bitcoin Netflows Show 13.7k BTC Exited Exchanges In A Single Day
As pointed out by an analyst in a CryptoQuant post, the BTC netflow has observed a sharp negative value recently.
The “all exchanges netflow” is an indicator that measures the net amount of Bitcoin entering or exiting wallets of all centralized exchanges.
The metric’s value is simply calculated by taking the difference between the exchange inflows and the exchange outflows.
When the value of the netflow is positive, it means a net amount of coins is moving into exchanges as inflows overwhelm the outflows.
Such a trend can be bearish for the price of BTC as investors usually deposit their crypto to exchanges for selling purposes.
Related Reading | No Bitcoin Please: Warren Buffett Says He Won’t Pay Even $25 For All The Bitcoins In The World
On the other hand, a positive netflow, when prolonged, can prove to be bullish for the value of the crypto as it may be a sign of accumulation from investors.
Now, here is a chart that shows the trend in the Bitcoin netflows over the last few months:
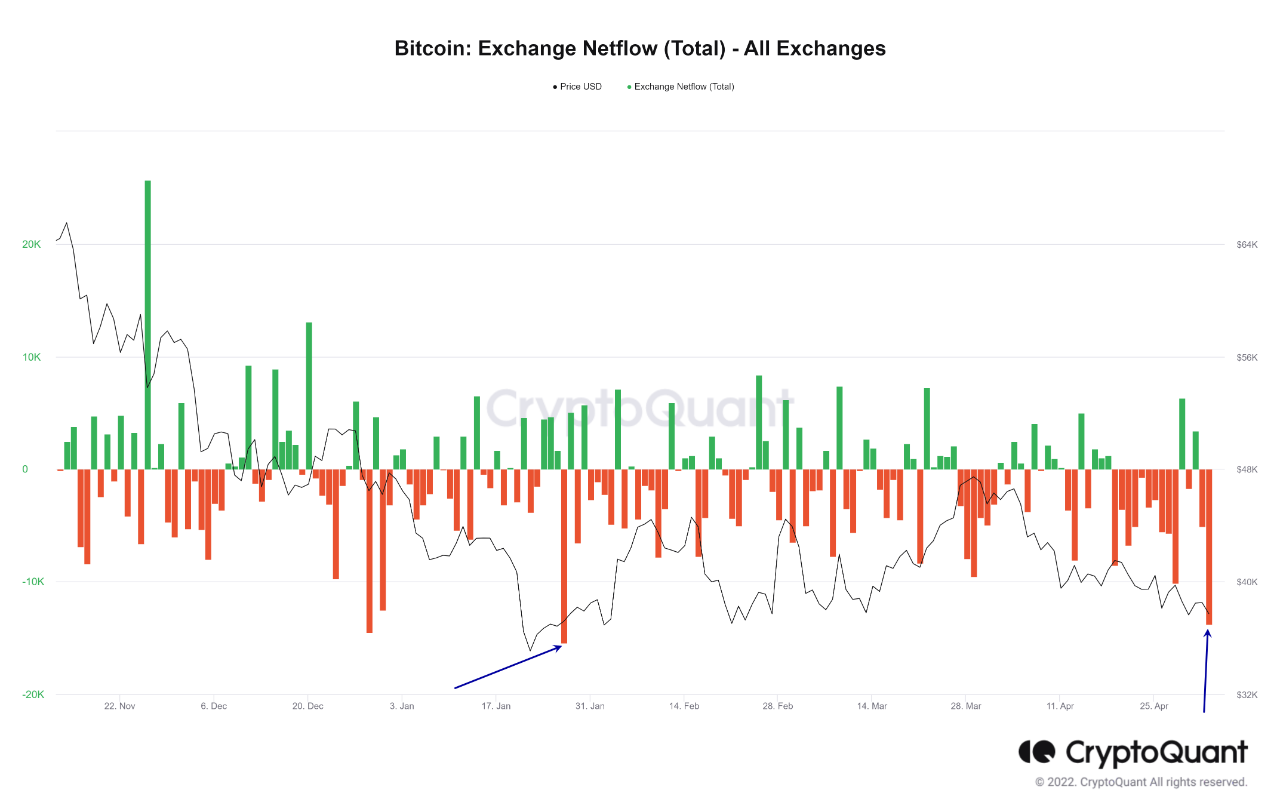
It seems like the value of the metric has been highly negative recently | Source: CryptoQuant
As you can see in the above graph, the Bitcoin netflow observed a large negative value just a couple of days back.
This red spike amounted to around 13.7k BTC leaving exchange wallets in one day. From the chart, it looks like a similarly deep-negative value of the netflow was also seen earlier in the year.
Related Reading | EPA Vs. Bitcoin: Dorsey, Saylor, Others Oppose Lawmakers’ Call For Action Vs. Crypto Mining
Shortly following that previous spike, the price of the coin had a rally. If the pattern holds this time as well, then BTC may enjoy some uptrend in the near future.
BTC Price
At the time of writing, Bitcoin’s price floats around $39.5k, down 1% in the last seven days. Over the past month, the crypto has lost 15% in value.
The below chart shows the trend in the price of the coin over the last five days.

Looks like the value of the coin has surged up over the last twenty-four hours | Source: BTCUSD on TradingView
Bitcoin has had a rough 2022 so far as the crypto’s price has struggled to make any permanent ground at higher levels.
The coin finally seemed to be making some real recovery just a month ago as it crossed the $47k mark, but since then the price has again dwindled down and now consolidates below the $40k level.
Featured image from Unsplash.com, charts from TradingView.com, CryptoQuant.com
