
Ethereum Attempts To Climb North; Is It Eyeing $3000?

Ethereum was trying to move on the upside, although modestly. The price action has been tight as the range that ETH was trading remained between $2800 and $2900 respectively.
Prices have been consistently trying to restest the $2900 mark but have faced rejection from the aforementioned level.
Sellers currently have pushed the price beneath the $2900 mark. Over the last week, ETH lost over 7%, however, in the past 24 hours the king altcoin showed signs of recovery. The coin registered a 1% jump in prices. This development could make it possible for the bulls to re-enter the market.
It is a good sign that the bulls have been buying at lower price levels for the altcoin. This signals that prices might shoot up over the upcoming trading sessions.
Ethereum Price Analysis: One Day Chart
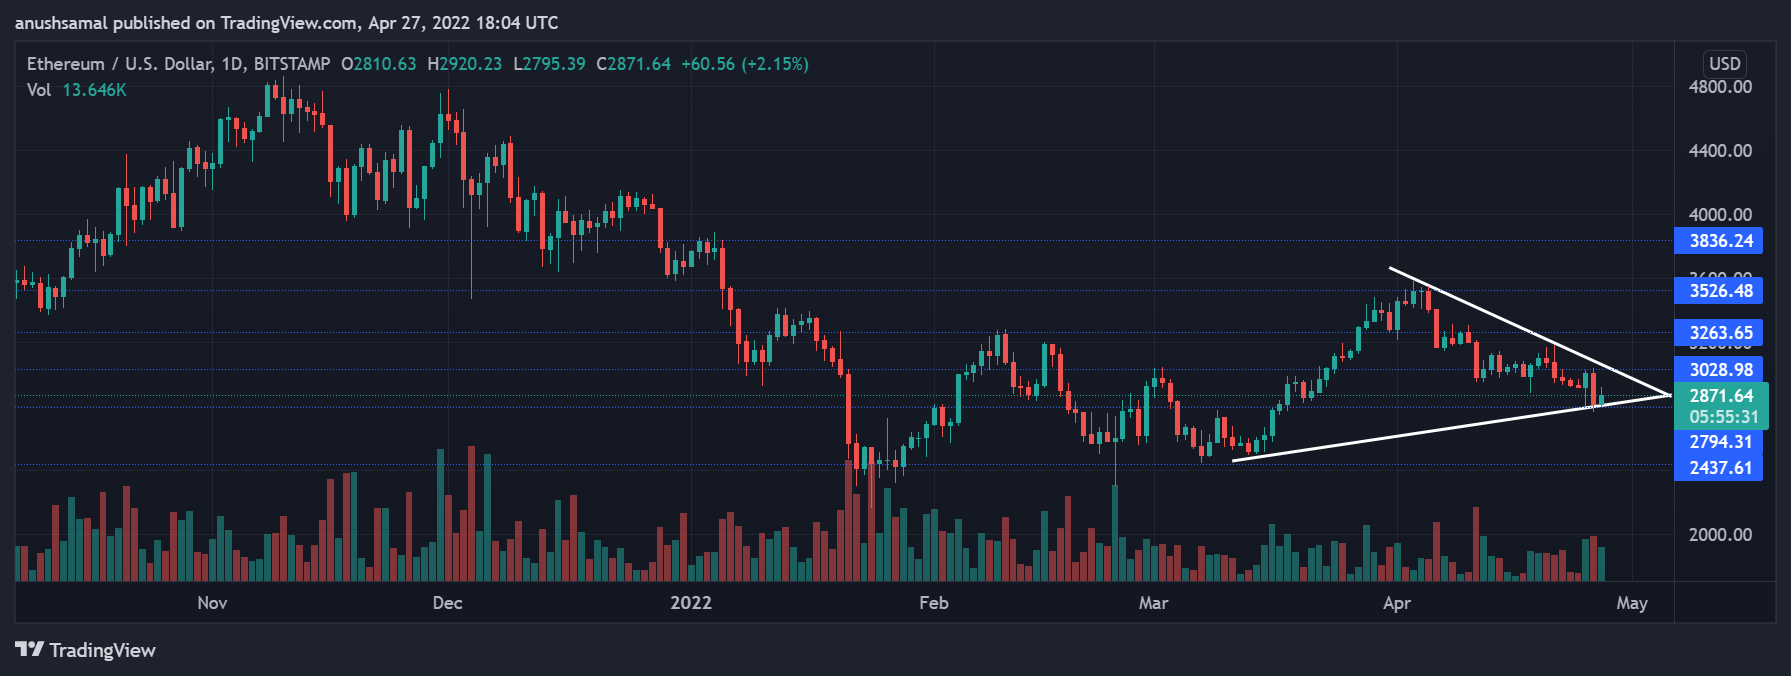
Ethereum was priced at $2871 at the time of writing. Its immediate mark of resistance was at $3028, over the past immediate trading sessions ETH lost vigour and got rejected from the $3000 price mark.
The coin depicted signs of positive price action as the volume traded was seen in green as the closing price was higher than the previous session.
In case ETH manages to push its way up then it could break past the $3000 mark and trade close to $3263. On the flipside, the local support level for the coin was at $2794 and failing to trade over which ETH would trade at $2437.
The king altcoin depicted an ascending triangle, which is characterised to be bullish. An ascending triangle positive continuation pattern. It has a rising lower trendline and a flat upper trendline. Buyers at the moment have tried to overpower sellers as ETH continues to make higher lows.
Related Reading | Why This Ethereum Indicator Points to Bullish Continuation
Technical Analysis
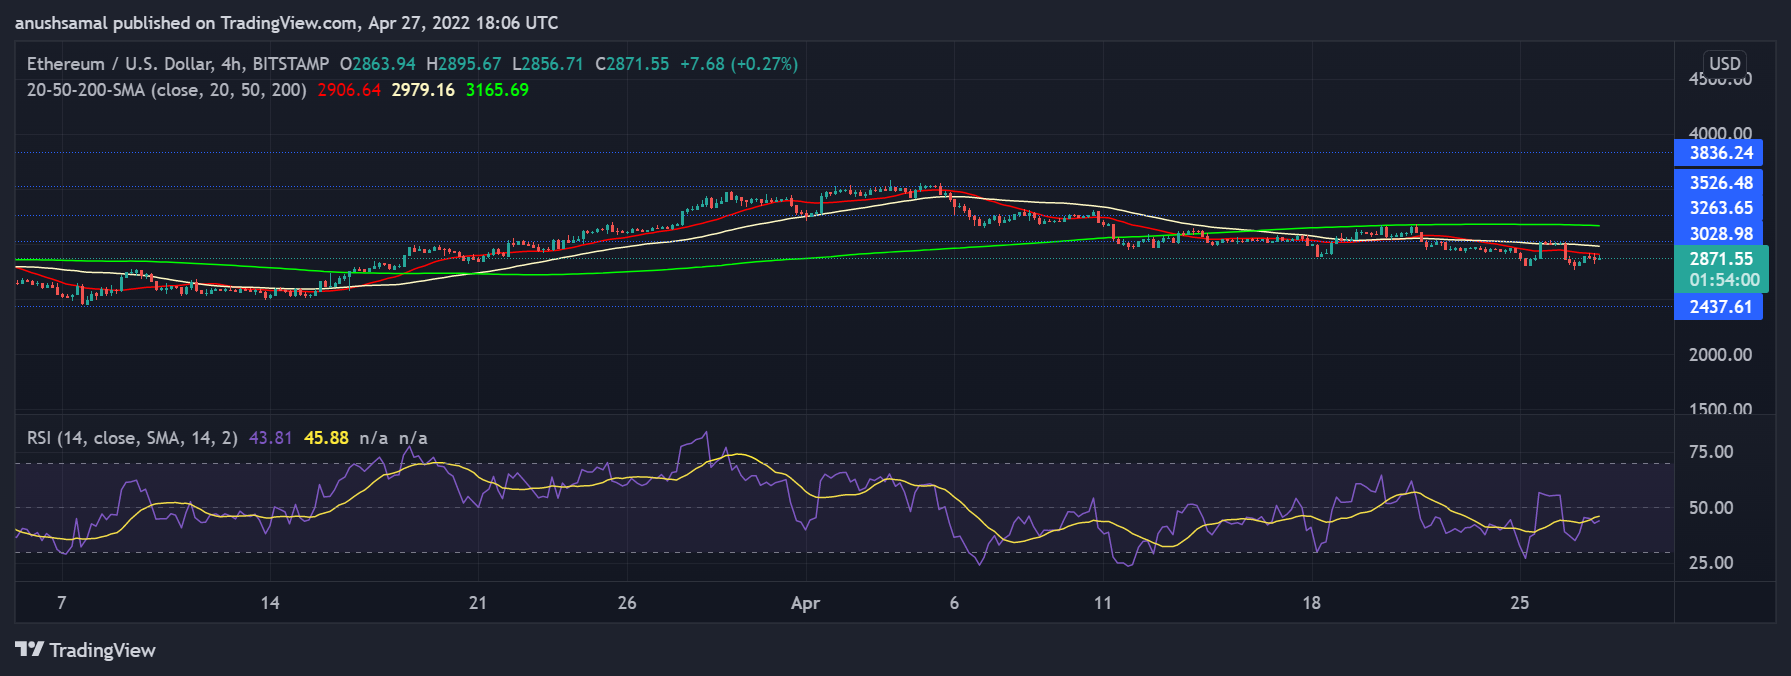
Ethereum’s brief recovery could try to push prices above the 20-SMA line. At the moment, ETH was trading beneath the 20-SMA line which signifies sellers have taken over the market in the short term.
It is to be noted that buyers had pushed ETH’s prices to trade above the 20-SMA just 24 hours back even when prices were dropping.
This reading meant that buyers have been aggressively buying the asset at lower price levels in anticipation that prices would increase.
On the Relative Strength Index, even though the indicator was placed below the half-line it noted a slight uptick. An uptick reconfirms the possibility of buyers returning to the market.
Ethereum’s choppy prices have reflected on the Awesome Oscillator. The indicator depicts price momentum, however, despite flashing red histograms ETH displayed signs of recovery.
The red histograms were declining in size indicating that ETH might climb over the next trading sessions.
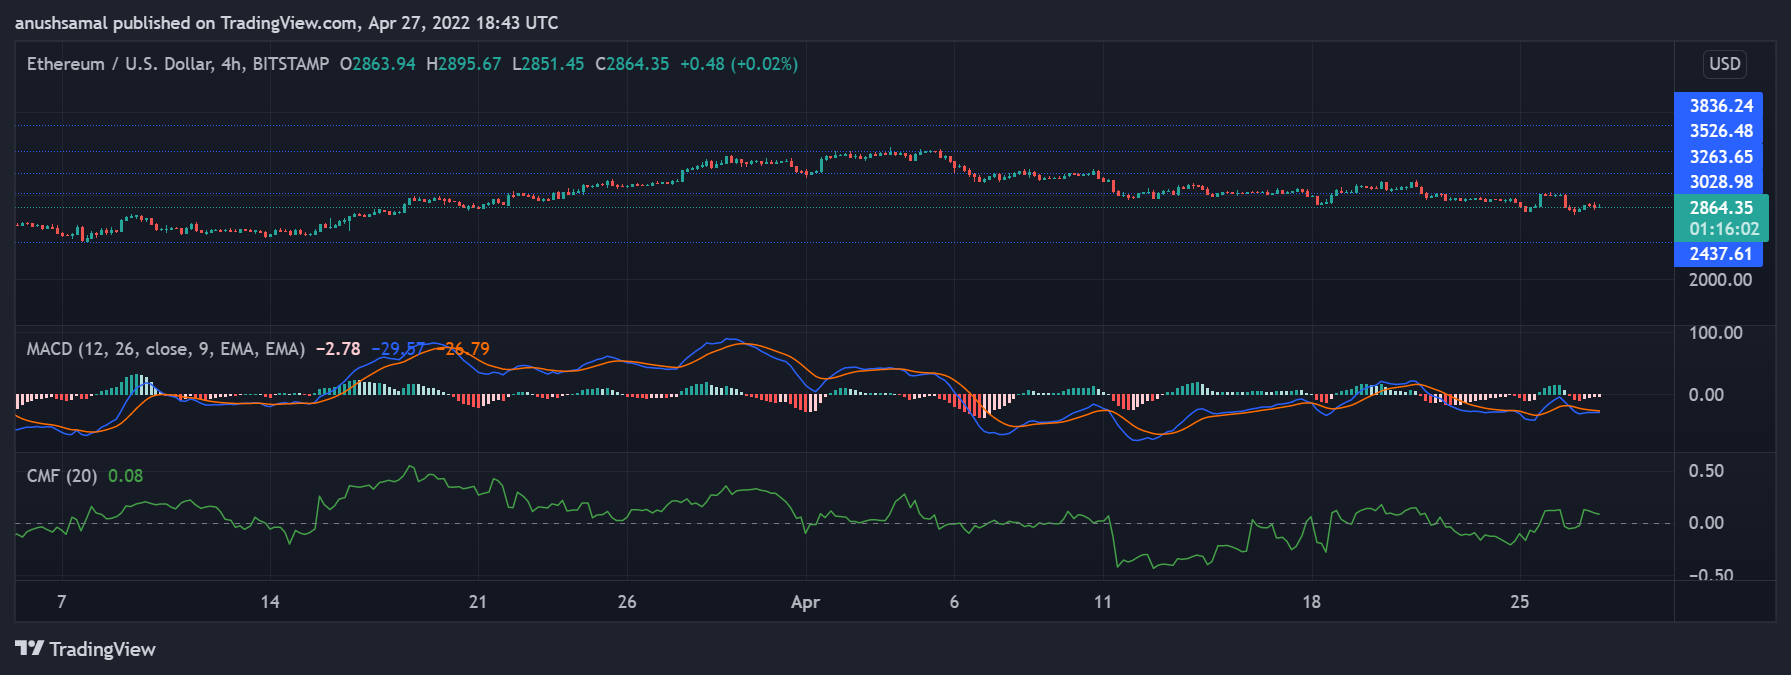
Chaikin Money Flow indicated that capital inflows were more than outflows despite Ethereum struggling to break past the $3000 mark.
This corresponds with the above indicators that despite current bearishness, ETH is eying its immediate resistance mark.
Related Reading | Institutional Investors Bearish On Bitcoin, Ethereum. Here’s What They’re Buying
Featured image from UnSplash, chart from TradingView.com
