
Ethereum Forms Bullish Pattern But This Level Is Crucial

Ethereum extended decline and tested the $1,920 support against the US Dollar. ETH is rising and might revisit the key $2,085 resistance zone.
- Ethereum remained stable above the key $1,920 support zone.
- The price is now trading above $2,000 and the 100 hourly simple moving average.
- There was a break above a major bearish trend line with resistance near $1,980 on the hourly chart of ETH/USD (data feed via Kraken).
- The pair could rise further, but the $2,085 zone presents a major hurdle.
Ethereum Price Recovers Above $2K
Ethereum extended decline after it broke the $1,950 support and the 100 hourly simple moving average. However, the bulls took a strong stand near the $1,920 support.
A low was formed near $1,911 and the price started a recovery wave. There was a clear move above the $1,950 and $1,960 resistance levels. Ether price climbed above the 50% Fib retracement level of the downward move from the $2,083 swing high to $1,911 low.
Besides, there was a break above a major bearish trend line with resistance near $1,980 on the hourly chart of ETH/USD. Ether price is now trading above $2,000 and the 100 hourly simple moving average.
The price is now facing resistance near the $2,020 level. It is near the 61.8% Fib retracement level of the downward move from the $2,083 swing high to $1,911 low. The next major resistance is near the $2,040 level. The main resistance is now forming near the $2,085 level. A close above the $2,085 level could open the doors for a steady increase.
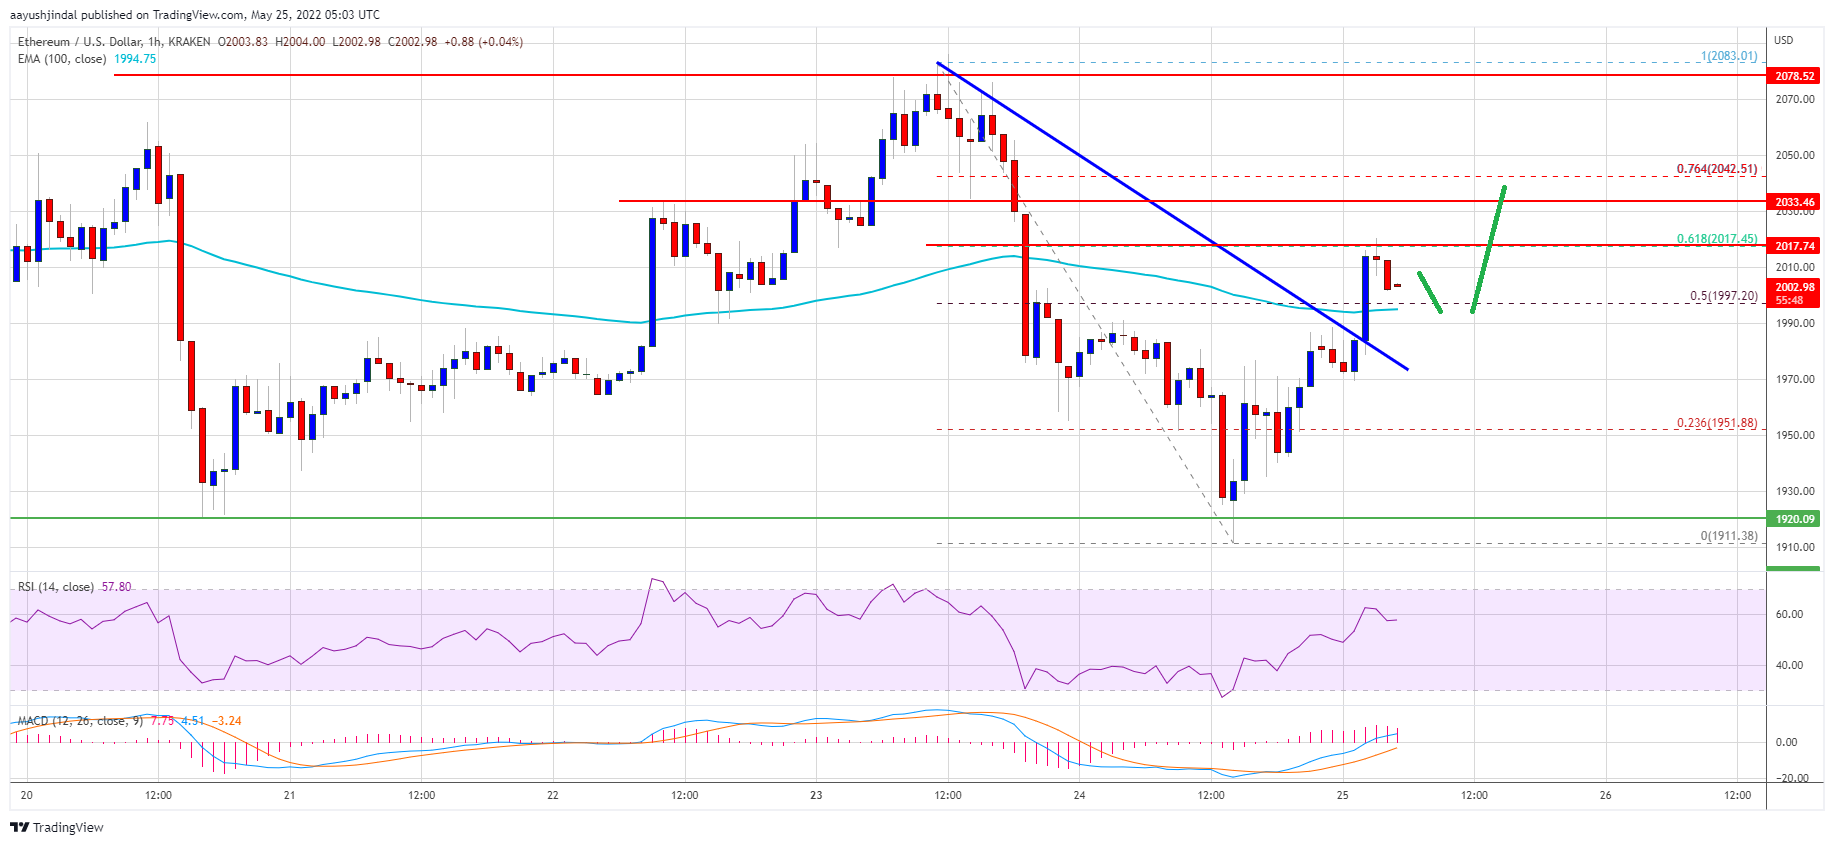
Source: ETHUSD on TradingView.com
In the stated case, ether price could rally towards the $2,200 resistance. Any more gains may perhaps send it towards the key $2,250 resistance zone.
Fresh Decline in ETH?
If ethereum fails to recover above the $2,400 resistance, it could start a fresh decline. An initial support on the downside is near the $1,995 zone and the 100 hourly SMA.
The next major support is near the $1,970 level. A downside break below the $1,970 level might call for another test of the main $1,920 support. Any more losses may perhaps clear the path for a sharp decline to $1,800.
Technical Indicators
Hourly MACD – The MACD for ETH/USD is now losing momentum in the bullish zone.
Hourly RSI – The RSI for ETH/USD is now above the 50 level.
Major Support Level – $1,970
Major Resistance Level – $2,085
