Solana (SOL) Could Register An Upswing, Thanks To This Pattern
Solana has been currently trading within a consolidation phase. Despite a recovery on charts, the coin is trading at the level it last traded in the month of August, last year. Over the last few days, the coin observed lateral price movements.
Usually after a consolidated phase, it can be assumed that the altcoin could witness a change in the price movement. Technical outlook painted a positive price action for Solana on both its hourly as well as daily chart.
Solana has recovered by over 40% from its lowest price which was recorded mid month, this year. At the moment, Solana has been trading between $44 and $58 price level. If the coin has to invalidate the bears completely, a jump above the $70 will be required.
As the price of the asset started to note northbound movement, buyers regained confidence and started to re-enter the market.
Solana Price Analysis: One Day Chart

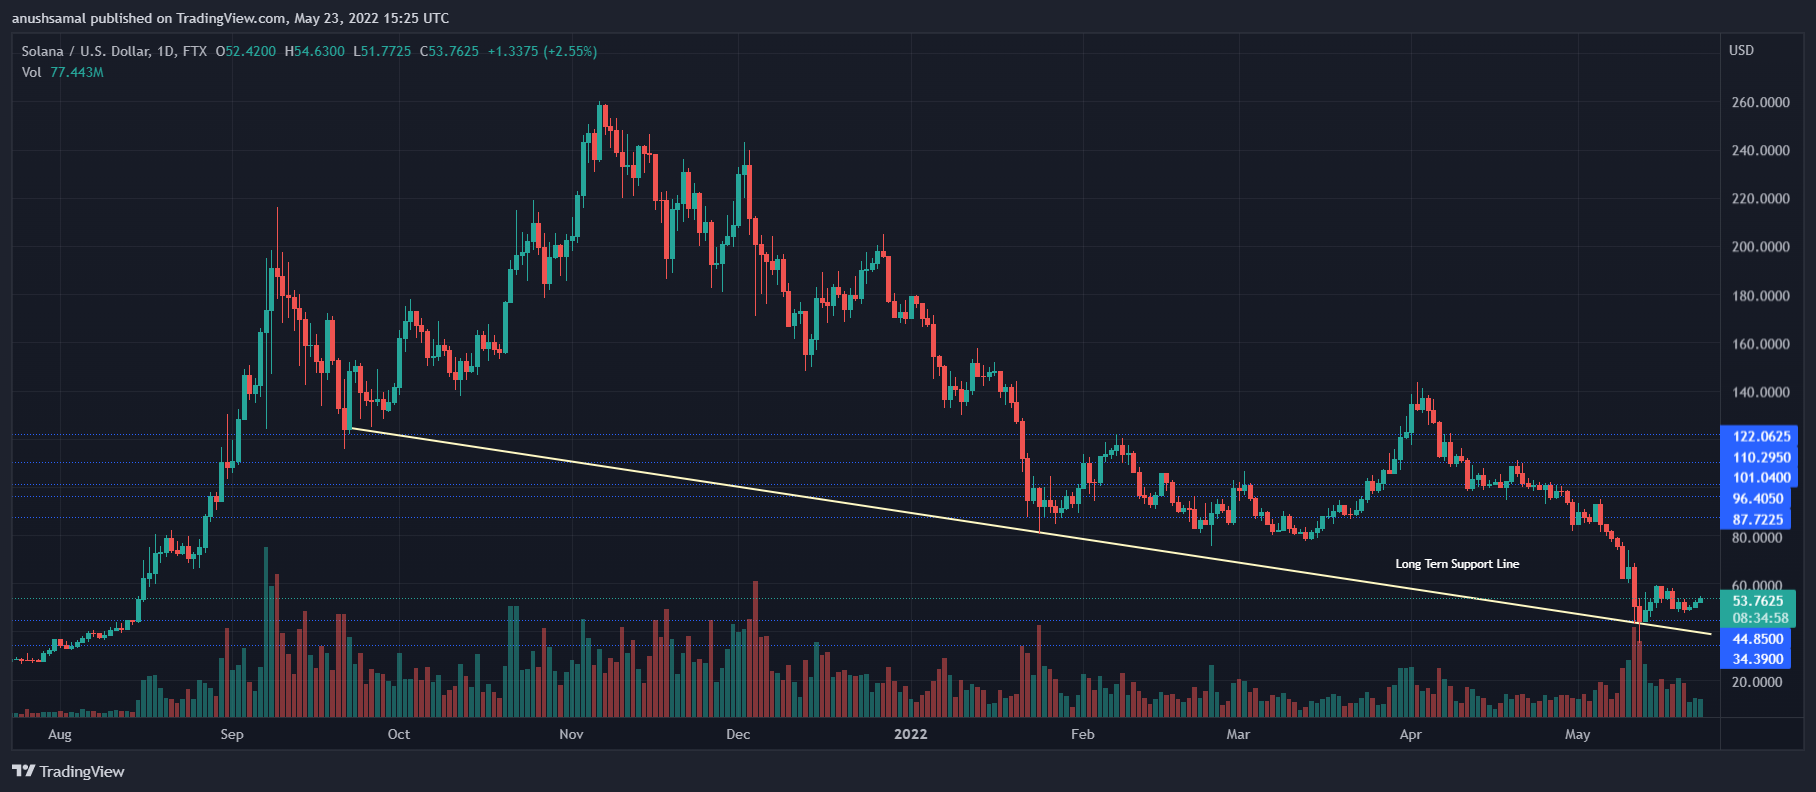
The altcoin was exchanging hands at $53 at the time of writing. Although, SOL was moving sideways, the technical pointed towards a possible bullish revival. Nearest resistance line for the coin stood at $60 and if the coin struggles too much to break past the aforementioned level then SOL could attempt to visit the next support line.
The next price floor for SOL was at $44.85 and then at $34. Solana has visited these levels almost over ten months ago when the coin was on a bullish price action.
Bullishness can be pointed out because SOL has just managed to bounce off the long standing support line (yellow) of $40 on the above chart. This particular price action can be attributed to a further upside movement.
Related Reading | Solana TVL Sees Sharp Decline, Reaches 2022 Low
One Hour Chart

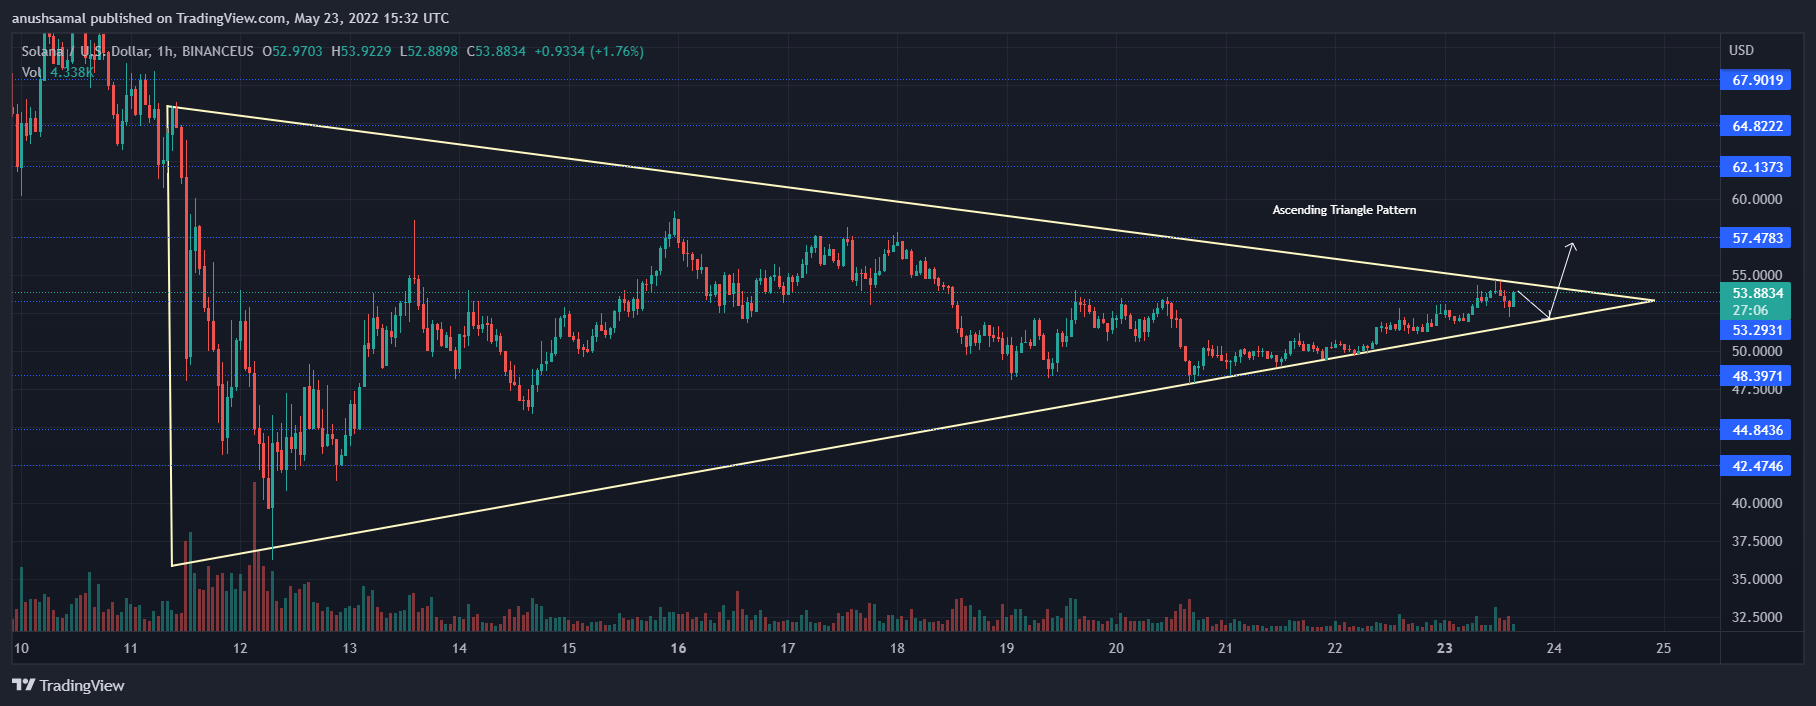
An ascending triangle has been formed on the one hour chart. This formation is tied to a bullish price action in the market. Solana could soon break past $53 price level and challenge the $60 mark. If the buyers are consistent in the market, this could happen even sooner.
Volume of the coin was seen in the green which is again directly related to bullish strength in the market. It is possible that the coin might consolidate over the immediate trading sessions and then finally break past the sideways trading pattern.
Technical Analysis

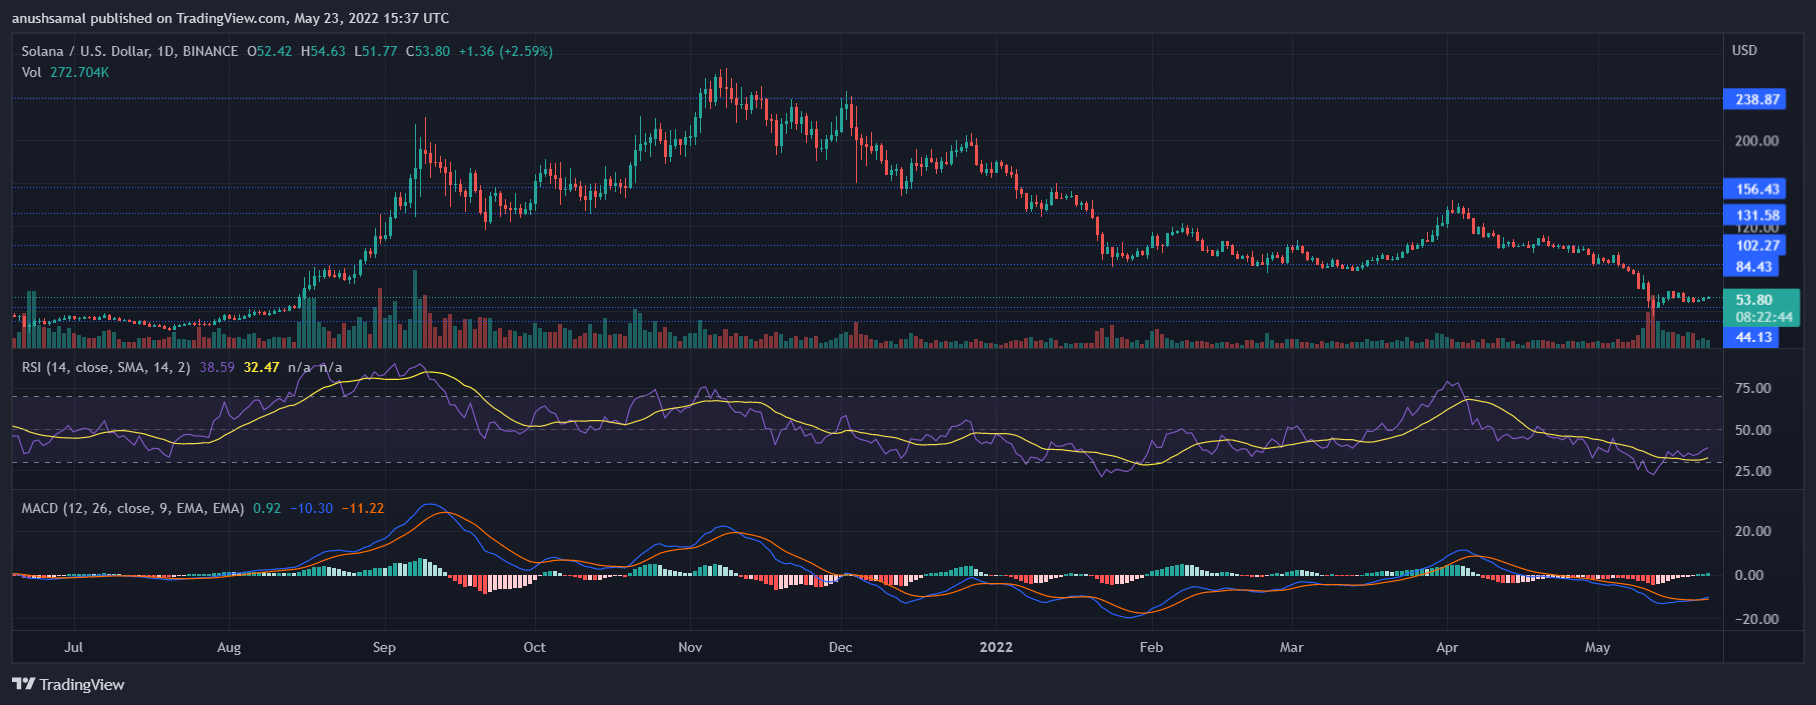
Buying strength returned on the charts for Solana. As the coin regained some of its vigour back, investors are also back in the market. As seen on the Relative Strength Index, the indicator noted an uptick. Solana was not oversold anymore, however, the coin still witnessed more selling pressure compared to buying pressure in the market.
Moving Average Convergence Divergence noted green signal bars after noting a bullish crossover. The green signal bars highlight a change in the price momentum along with depicting that selling pressure was declining. With decline in selling pressure, Solana would again attempt to move past its immediate resistance mark.
Related Reading | LUNA Records 100% Growth In A Single Day. More Upside Coming?


