
Technical analysis suggests the Bitcoin bull phase is still intact

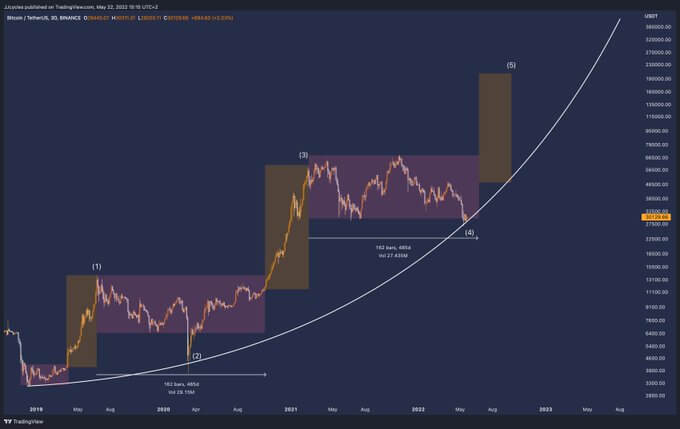
Crypto trader @JJcycles tweeted, “we’re still in a bull market,” accompanied by an Elliot Wave analysis of the Bitcoin price supporting this statement.
However, technical analysis does have its limitations. And, against a backdrop of increasingly bearish macro sentiment, it would take a miracle for this to play out.
Elliot Wave analysis shows the fifth wave is in play for Bitcoin
Elliot Wave analysis identifies wave patterns within markets in the hope of predicting future price movements. The theory posits that price movement is predictable, as prices are derived from investor sentiment, which can be plotted via repeating up and down wave patterns.
This tool consists of two distinct waves, impulse waves (also called motive), composed of five discrete up and down patterns that end with the fifth and final wave or peak. And corrective waves, which occur after the fifth impulse wave and signal the start of a macro decline.
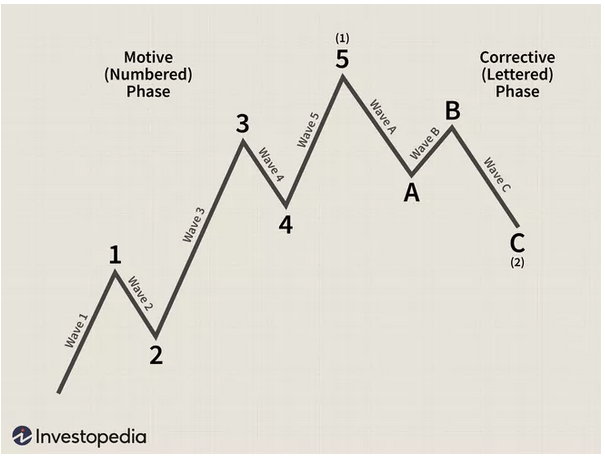
“the Elliott Wave theory is the analysis of long-term trends in price patterns and how they correspond with investor psychology. These price patterns, referred to as ‘waves’, are built on specific rules that were developed by Ralph Nelson Elliott in the 1930s.”
According to @JJcycle, the first impulse wave peaked around June 2019, leading to a cycle of ups and downs, taking us to the present moment – the bottom of the fourth wave. @JJcycle predicts the onset of the fifth and final impulse wave, which peaks at around $200,000 by September/October.
The limitations of technical analysis
Technical analysis (TA) attempts to capture investor sentiment by analyzing price trends and chart patterns. It takes no account of fundamentals, such as network activity or the number of new wallets. Nor does it consider macro analysis, such as payroll data, production indicators, inflation rate, or jobless claims.
For those reasons, critics argue that TA gives only a reductionist view of what is happening in a given market.
What’s more, TA is open to interpretation and subject to arbitrary assumptions. For example, in @JJcycle’s analysis above, one could argue that November 2021’s peak price was the top of the fifth wave, and we are already in wave A of the corrective phase.
Either way, the coming weeks will reveal more about the current situation.
